
The coach dashboard: your season at a glance
Every coach has a picture of how their team is doing — and that picture runs three weeks behind on average. The dashboard is the correction: the current state of your season, on one screen, every time you open the app.
What's on the dashboard
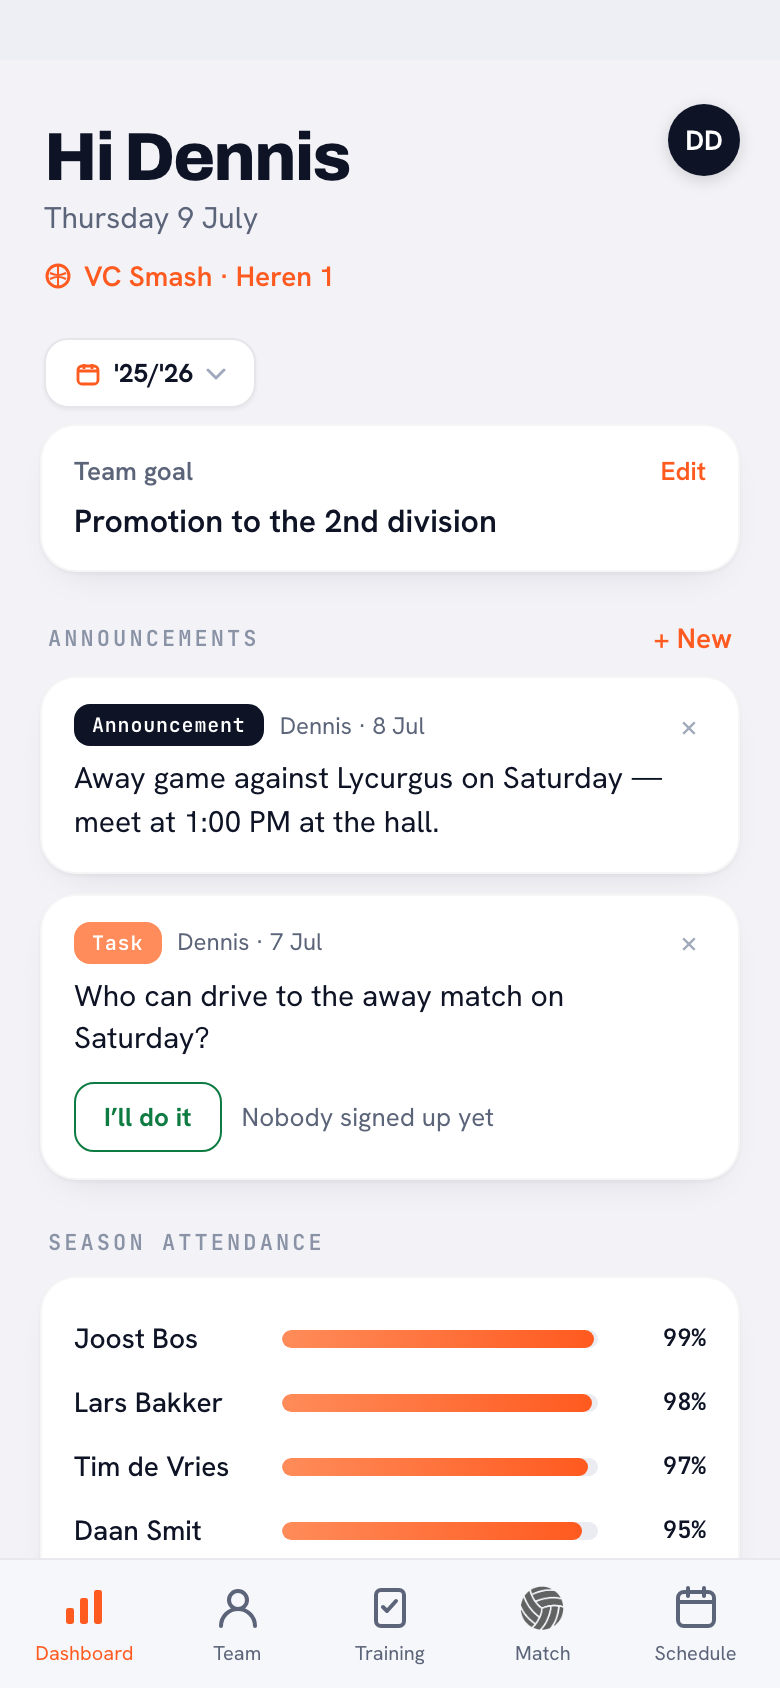
The dashboard opens with what gives direction and measures what matters: at the top the team goal — the sentence the season revolves around — below it the season attendance per player (the bars from 100% down to the straggler) and the effort podium with the players pulling hardest. Goal, behaviour and culture on one screen.
The weekly dashboard minute
Make it a habit: one fixed moment per week (Sunday evening works well), thirty seconds of looking with three questions. Is attendance moving? A player who drops two places gets a quick word this week. Does the podium match your gut feeling? If not, your gut is due an update. Is the goal still the goal? As long as the answer is yes, you don't need to do anything — the dashboard exists precisely to reassure you without having to dig.
From signal to action
The dashboard doesn't answer detail questions — for those you click through to the player statistics or the match overview. Its job is to signal: the sinking bar, the shift on the podium, the goal drifting out of sight. Rule of thumb: the dashboard decides where you dig in this week, not what you'll find.
Share the dashboard with the team now and then. One screenshot at the start of practice — 'this is where we stand' — makes the season a shared possession. Teams that see their own attendance correct themselves.
Frequently asked questions
Why are there no match statistics on the dashboard?
The dashboard shows the constants of the season (goal, attendance, effort); match data lives in the match overview and the player profiles. Signal and depth are deliberately kept apart.
How up to date is the dashboard?
As up to date as your record-keeping: every ticked-off practice and completed match feeds through immediately. Track consistently and you have a dashboard that never lies.
My attendance bars are dropping across the team — now what?
That's the signal to dive into attendance tactics: first check the trend per month and per practice day, then read the article on raising practice attendance for the approach.
Try it yourself in Koach
Less admin, more coaching — starting at your next practice.
Get started with Koach